
In early February 2017, reservoirs were filling up and more rain was anticipated, so the managers at Oroville Dam increased outflow down the spillway to make room for more water. On Tuesday, February 7th, the normally smooth flow through the spillway changed to a violent splash. The spillway was turned off to see what was going on. There was a huge hole in the concrete.
This was the start of a chain of events that led to the emergency spillway coming within a few feet of failing, and 200,000 people being evacuated from Oroville and Yuba City with pretty much zero notice.
The story is told by four graphs.
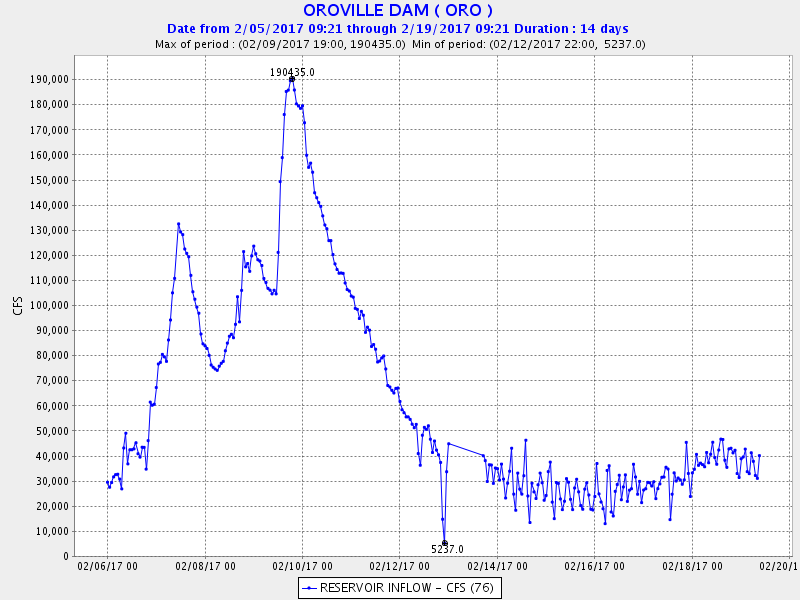
First the inflow to Lake Oroville, which is set by nature,
no significant upstream dams to regulate it.
100KCFS of inflow is quite large, the biggest in a couple decades,
but the dam should have been able to handle it without problems.
Both the regular spillway and the emergency spillway
were supposed to be able to handle over 200KCFS each.
That turned out to be wildly optimistic.
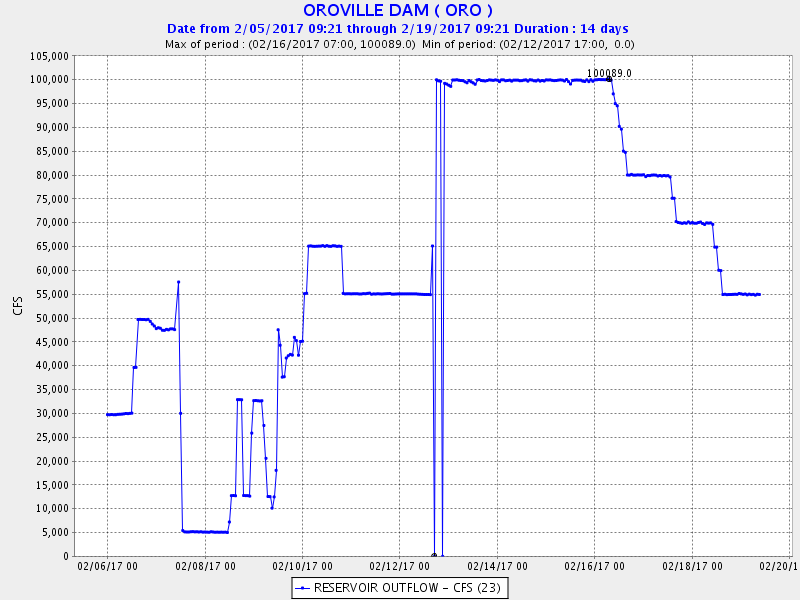
Second graph, the outflow.
It started at 30KCFS, was raised to 50KCFS for a day and then
dropped to 5KCFS.
That actually represents zero down the spillway and 5K through
the powerhouse.
(The powerhouse flow would later be turned off to avoid damage
to the expensive turbines from back-pressure.)
The spillway flow stayed at zero for a day while everyone gawped
at the hole, then went on/off/on/off while the managers tried to
decide what to do.
As the inflow continued and the lake rose, they eventually
committed to using the spillway and letting it erode away.
They spilled 65KCFS, then backed off a little to 55KCFS and
left it there for a few days.
Their models showed the lake would rise to just about the
level of the emergency spillway but not much higher.
Maybe they were even looking forward to testing out the emergency
spillway for the first time ever.
On the morning of Saturday 11Feb the lake went over 901' and
the emergency spillway went into action.
At first it looked good, but after a few hours the water
started making gullies and one of the gullies eroded
upstream to within a few feet of the emergency spillway
structure.
At that point the CA DWR issued an immediate evacuation order
for Oroville, saying the emergency spillway was expected
to fail within an hour.
The evacuation order was soon extended to Yuba City / Marysville.
The dam managers raised flow through the regular spillway to
100KCFS, to lower the lake below the emergency crest as quickly
as possible.
The whole state watched overnight and the next day.
Would the emergency spillway hold?
Would the regular spillway erode more?
As it turned out, both spillways held.
The evacuees came home after two days.
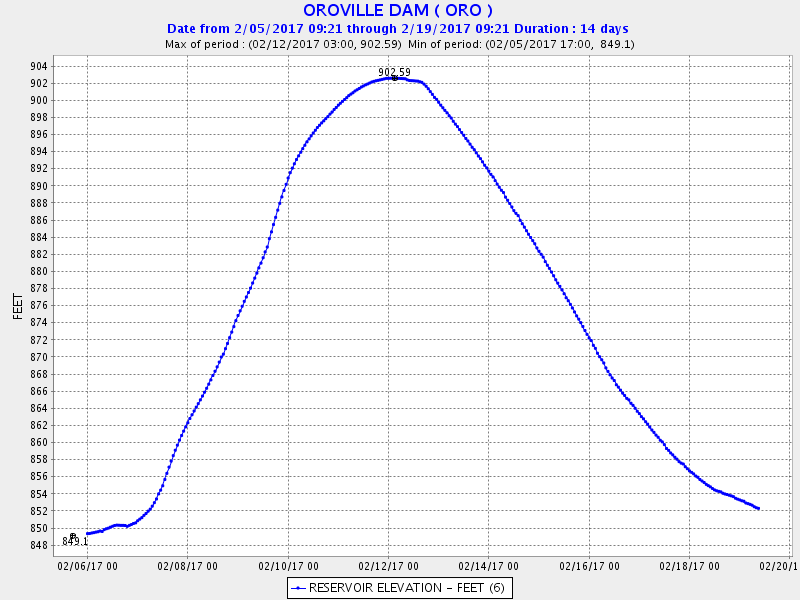
Third graph, the lake level.
This shows feet, not CFS.
The key level is 901', the height of the emergency spillway crest.
There's no gate on this spillway.
Once the lake reaches this level it automatically pours over the
emergency spillway and onto an unreinforced hillside.
The peak was 902.59', so 1.59' of water was flowing over the
emergency spillway - about 12KCFS.
The lake stayed above 901' for a little more than a day.
It's easy to see the inflection point on this graph where the dam
managers raised outflow to 100KCFS.
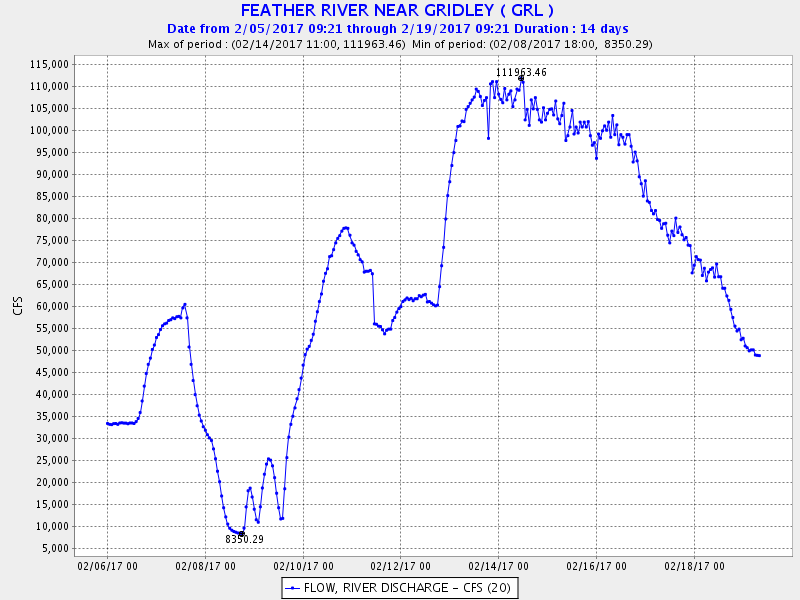
Finally, the flow just downstream near the town of Gridley.
When the Oroville outflow went to 100KCFS, that showed up
at Gridley a few hours later.
The river rose to barely above flood stage.
The town itself is three miles away from the river and was fine.
Some roads and buildings at the river got wet.
So the choice of 100KCFS outflow was well-calculated.
As I write this, a couple weeks afterwards, we are a few hours away from another major atmospheric river event hitting Northern California. Lake Oroville should be ok, since it has been lowered so much. Other reservoirs may have problems, though. Lots of them are full, the ground is saturated, and downstream rivers are already at flood stage in many places. I fear I'll be writing up another of these reports in a few days.
Back to Flow Event Snapshots.
Back to River Flow Page.
Back to Jef's Web Page.
